
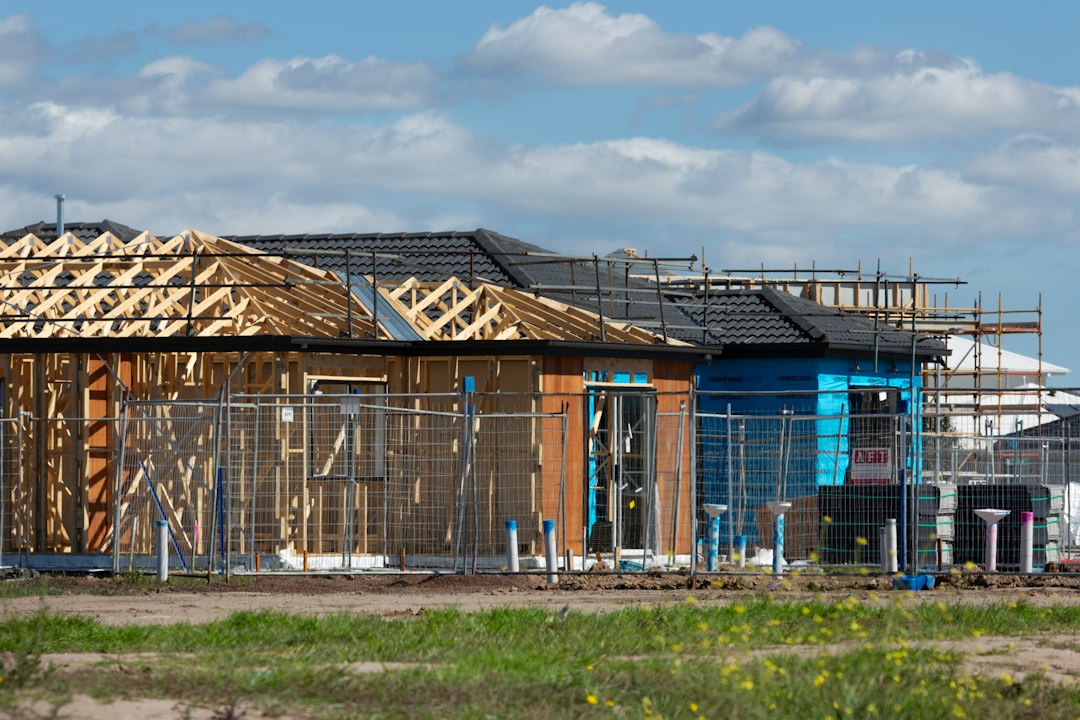
To calculate price per square foot, divide a home’s sale price by its finished, above-grade living area: a $300,000 sale on 1,500 square feet works out to $200 per square foot. The formula takes ten seconds, but the number is only useful if the square footage is measured the same way on every home you compare.
For investors and wholesalers, price per square foot is a screening tool, not a valuation. This guide shows the math, the measuring rules lenders use, how to build a clean $/sq ft range from comps, and the situations where the number points you to the wrong offer.
The price per square foot formula
The basic formula is:
Price per square foot = sale price ÷ finished above-grade square footage
A few quick examples:
| Sale price | Finished above-grade sq ft | Price per sq ft |
|---|---|---|
| $185,000 | 1,240 | $149 |
| $312,000 | 1,860 | $168 |
| $428,500 | 2,410 | $178 |
| $96,000 (as-is, needs full rehab) | 1,100 | $87 |
You can run it in reverse, too. If renovated three-bedroom homes in a subdivision sell for about $175 per square foot, a 1,400-square-foot house that will be finished to the same standard suggests an after-repair value near $245,000 (1,400 × $175). That reverse calculation is where investors get into trouble, because it assumes the subject house really is like the comps in every way except size.
Which square footage to use
The price is easy to confirm from a deed or closing record. Square footage is the weak link. The same house can show three different numbers on the tax card, the listing, and the appraisal. The National Association of REALTORS notes in a piece on square footage disputes that county and state public record standards do not necessarily match the standards lenders use for appraisals.
The ANSI standard lenders use
Fannie Mae requires appraisers to measure using the ANSI Z765-2021 standard for appraisals with an effective date of April 1, 2022 or later, according to its ANSI measurement fact sheet, a change the Pennsylvania Association of Realtors also flagged for its members before it took effect. The key rules for single-family homes are:
- Below-grade space is excluded from gross living area. Any level that is partly or fully below grade counts as a basement, even if it is finished and has a walkout.
- Ceiling height matters. Finished areas must have a ceiling height of at least 7 feet. In rooms with sloped ceilings, at least half of the finished area must reach 7 feet, and no portion under 5 feet counts.
- Measurements are precise. Measurements are taken to the nearest inch or tenth of a foot, and the final square footage is reported to the nearest whole square foot.
- Exterior dimensions for houses. For detached and attached homes, appraisers measure the exterior of each floor; for condominiums, interior perimeter dimensions are used, as NAR’s article explains.
Appraisers can depart from ANSI in limited cases, and Fannie Mae assigns a specific exception code when they do. For your purposes the rule is simpler: when you compare homes, use above-grade finished area for every one of them, and list basements separately.
Where tax records and listings go wrong
County assessors may include finished basements, enclosed porches, or additions that were never permitted. Listing agents sometimes copy the assessor figure, use a builder’s plan, or round generously. Neither is necessarily wrong for its own purpose, but mixing sources in one comp set can swing your $/sq ft by 10% or more.
A practical fix: pull square footage for every comp from the same source, ideally the MLS field that reflects appraised gross living area, and note any home where the listing remarks mention a finished basement or bonus room that may be counted inconsistently.
How to calculate price per square foot from comps
Here is a repeatable process for building a $/sq ft range you can actually use.
- Pull sold comps, not listings. Use closed sales from the last three to six months, within roughly half a mile in suburban areas and tighter in dense cities. Our guide to real estate comps covers how to pick them.
- Match the property type. Single-family to single-family, same general age and style, same school district if possible.
- Match the condition tier. Separate fully renovated sales from dated or distressed ones. This step is the one most beginners skip.
- Stay within a size band. Keep comps within about 20% of the subject’s living area. Larger homes usually sell for less per square foot, smaller ones for more.
- Standardize square footage. Use above-grade finished area for every home and note basements separately.
- Calculate $/sq ft for each comp. Divide each sale price by its square footage.
- Look at the range and the median. Throw out obvious outliers, like a sale between family members or a house that sold with a pool and a guest cottage.
- Adjust for what $/sq ft cannot see. Lot size, garage, extra bathroom, location on a busy street, and basement finish all need separate adjustments.
Worked example: a renovated comp set
The figures below are hypothetical and rounded, for illustration only.
| Comp | Sold price | Above-grade sq ft | $/sq ft | Notes |
|---|---|---|---|---|
| A | $259,000 | 1,480 | $175 | Fully renovated, 2-car garage |
| B | $244,000 | 1,390 | $176 | Renovated, 1-car garage |
| C | $271,500 | 1,620 | $168 | Renovated, slightly larger |
| D | $236,000 | 1,310 | $180 | Renovated, smaller home |
| E | $305,000 | 1,550 | $197 | Renovated plus finished basement counted in listing |
Comp E’s listing counted 400 square feet of finished basement in its 1,550-square-foot total. Using the listing figure, it looks like $197 per square foot; using above-grade area only (1,150 square feet), it jumps to about $265, because the price also bought a finished lower level the other homes lack. Either way it is not comparable on a per-foot basis. Drop it, or keep it with a separate basement adjustment. The remaining four comps cluster between $168 and $180, with a median near $175.
For a 1,450-square-foot subject house that will be renovated to the same level, $175 × 1,450 suggests a value around $254,000. That is a starting point. If the subject sits on a busier road or lacks a garage, adjust down. Then check the result against the ARV calculator and the full method in how to calculate ARV.
Why price per square foot misleads investors
Price per square foot compresses an entire house into one number. That is useful for spotting outliers and dangerous when you use it to set an offer.
Size bias
Larger homes almost always show a lower $/sq ft than smaller ones in the same neighborhood, because the kitchen, bathrooms, roof and land cost the same whether the house has 1,200 or 1,800 square feet. Apply a $/sq ft from small comps to a large subject and you overvalue it. Apply it from large comps to a small subject and you undervalue it.
Condition bias
A distressed sale at $95 per square foot and a renovated sale at $180 in the same subdivision are not two data points on one line. They are two different products. Averaging them gives a number that describes neither.
Features that square footage ignores
Lot size, garages, basements, pools, views, school boundaries and bedroom count all affect value without changing above-grade area. A three-bedroom house can sell for more per square foot than a two-bedroom of the same size because more buyers want three bedrooms.
Location within the neighborhood
Two identical homes on either side of a busy road, a rail line or a school boundary can sell for very different prices. Price per square foot will report that as noise.
Market timing
In a shifting market, a $/sq ft figure built from sales six months old can be stale. When rates and inventory move, recent closings matter more than older ones.
Price per square foot as a screening tool
Used correctly, $/sq ft saves time. Here are the ways investors and wholesalers lean on it:
- Filtering leads. If a seller’s asking price works out to $220 per square foot in an area where renovated homes top out at $180, you know before you visit that the price is not workable.
- Spotting data errors. A comp that lands far above or below the rest is often a square footage error, not a real price.
- Pricing rehab scope. Contractors often quote renovation work per square foot. Our guide to estimating repair costs shows when per-square-foot rehab budgets work and when they miss.
- Sanity-checking an appraisal or BPO. If a broker price opinion comes back well outside your comp range, the $/sq ft spread helps you find out why.
- Talking to buyers. Cash buyers often think in $/sq ft for their exit. Knowing the renovated range in each neighborhood lets you speak their language.
Build three numbers for every neighborhood
Experienced wholesalers rarely carry one $/sq ft figure per area. They carry three, one for each condition tier, and update them every month or two from fresh closings:
| Condition tier | What it describes | Who buys at this level |
|---|---|---|
| As-is or distressed | Needs a full rehab: roof, systems, kitchen, baths | Flippers and landlords paying cash |
| Dated but livable | Works as-is, needs cosmetic updates | Owner-occupants with loans, some landlords |
| Fully renovated | Move-in ready, updated finishes | Retail buyers using financing |
The gap between the first and third numbers is the space a flipper works in. If renovated homes sell at $175 per square foot and distressed homes at $95, the $80 spread has to cover repairs, holding costs, selling costs and profit. When that spread narrows, deals get thinner for everyone, and your offers need to reflect it.
Turning $/sq ft into a value range with adjustments
Appraisers do not stop at price per square foot, and neither should you. After you have a $/sq ft range from size- and condition-matched comps, adjust for the features that per-foot pricing misses. The dollar amounts below are hypothetical placeholders to show the method; real adjustments come from paired sales in your own market.
| Feature difference vs comp | Hypothetical adjustment |
|---|---|
| Subject lacks a garage the comp has | − $8,000 |
| Subject has one fewer full bathroom | − $10,000 |
| Comp has a finished basement, subject does not | − $12,000 |
| Subject backs onto a busy road | − 3% to 5% |
| Subject has a larger usable lot | + $5,000 |
Apply the adjustments to each comp’s sale price, then recalculate. The adjusted values should cluster more tightly than the raw $/sq ft figures did. If they spread further apart, one of your comps probably does not belong in the set. Write down the reason for every adjustment so you can defend your number to a buyer, a lender or a seller who disagrees.
Price per square foot for rentals and land
The same idea extends beyond houses that are bought to resell:
- Rentals. Rent per square foot, annual or monthly, helps compare units, but larger units usually rent for less per square foot just as larger homes sell for less.
- Small multifamily. Price per unit is often more meaningful than price per square foot, because income comes from units.
- Land. Price per acre or per buildable lot is the norm. Price per square foot of land is common only for small urban parcels.
- Commercial property. Price per square foot is widely quoted, but income, cap rate and lease terms usually drive value.
When price per square foot is the wrong tool
There are deals where you should set the $/sq ft figure aside entirely:
- Unique homes. Historic houses, waterfront lots, homes with acreage or outbuildings rarely have true comps on a per-foot basis.
- Rural areas with few sales. When you only find two sales in a year within several miles, the $/sq ft range is too thin to trust.
- Major functional problems. A house with one bathroom for five bedrooms, a bedroom only reachable through another bedroom, or a foundation issue will not sell at the neighborhood rate even after repairs.
- Rapidly changing markets. When prices are moving month to month, rely on the most recent closings and pending sales rather than a six-month average.
- Income property. Rentals are valued on income. Use cap rate, cash flow and the cash-on-cash return calculator rather than $/sq ft.
A second worked example: catching a bad deal
These numbers are hypothetical and rounded, for illustration only.
A seller offers you a 2,300-square-foot house that needs a full renovation. Nearby renovated homes sell for $180 per square foot, so the seller’s agent points out that the house will be worth $414,000 after repairs. Your comps, however, are all between 1,300 and 1,700 square feet. The only two renovated sales above 2,000 square feet in the last year sold for $158 and $162 per square foot.
| Approach | $/sq ft used | Implied ARV |
|---|---|---|
| Small-home comps applied to a large house | $180 | $414,000 |
| Size-matched comps | $160 | $368,000 |
| Difference | $20 | $46,000 |
A $46,000 swing in ARV moves a flipper’s maximum offer by roughly the same amount, and it can turn a profitable wholesale assignment into a contract no buyer will take. This is exactly the kind of error a disciplined comp process prevents. Before you sign, run your number through the MAO calculator and read how to write a wholesale offer for how investors build in a margin.
Where to find reliable square footage data
- MLS records. Agents can pull sold data with above- and below-grade areas listed separately in many markets.
- County assessor records. Useful for consistency across a whole neighborhood, but check whether basements are included and whether recent additions appear.
- Appraisals. If a seller has a recent appraisal, its gross living area figure follows lender standards.
- Your own tape measure. On a deal you are serious about, measure the exterior during your walkthrough. A 200-square-foot difference matters at $150 per foot.
- Public data sites. Convenient for quick screening but often copy assessor data, so treat them as a first pass.
Remember that assessed values are not market values either; our guide to assessed value vs market value explains why tax figures lag.
Questions about price per square foot
Do you include the garage in square footage?
No. Garages, unfinished areas, porches and patios are not part of gross living area. They add value, but you account for them as separate features.
Does a finished basement count?
Under the ANSI standard used for Fannie Mae appraisals, below-grade space is not included in gross living area, even when finished. Value it separately, usually at a lower rate than above-grade space.
What is a good price per square foot?
There is no national “good” number. It depends entirely on the neighborhood, property type and condition. A good buy is one well below the renovated $/sq ft range for that specific area after you account for repair costs.
Is price per square foot the same as cost per square foot?
No. Price per square foot describes what a home sells for. Cost per square foot usually describes construction or renovation cost. Both are useful, but they answer different questions.
Should I use list prices or sold prices?
Use sold prices. List prices show what sellers hope for, while sold prices show what buyers actually paid.
Sharpen your deal analysis
Analyze every deal the same way
Get the free starter kit with our deal analyzer, starter contracts, a seller script and a buyer’s list checklist, so your numbers and your offers stay consistent.
Related guides
Fresh from the blog
Latest wholesaling guides
Massachusetts Foreclosure Process: A Stage-by-Stage Guide for Investors
The Massachusetts foreclosure process is mostly nonjudicial: after a 90-day right-to-cure notice and a short servicemembers case, the lender can…
Read the guide
Tired Landlords: How to Find Them, What to Say, and Deals That Fit
Tired landlords are rental owners who no longer want to deal with tenants, repairs or management and will trade some…
Read the guide
SEO for Real Estate Investors: How to Rank for Motivated Seller Searches
SEO for real estate investors means getting your website in front of homeowners who search for a fast or as-is…
Read the guide
How to Buy an Abandoned House: Find the Owner, Clear Title, Close
To learn how to buy an abandoned house, start with the fact most guides skip: someone still owns it. You…
Read the guide
DealMachine vs PropStream: Which Is Better for Finding Deals?
DealMachine vs PropStream compared: pricing, driving for dollars, list building and which tool suits a new wholesaler.
Read the guide
PropStream vs BatchLeads: Which One Should a Wholesaler Pick?
PropStream vs BatchLeads compared for wholesalers: pricing, data, skip tracing, texting and which one fits your first deals.
Read the guide
Liquidated Damages in Real Estate: How the Clause Protects Wholesalers
Liquidated damages in real estate are a sum, usually the earnest money, that the seller keeps as full compensation if…
Read the guide
Lead-Based Paint Disclosure: What Investors Must Do Before Selling or Renting
A lead-based paint disclosure is required before a buyer or tenant is bound on any home built before 1978. Here…
Read the guide
Chain of Title: How to Read It and Fix a Broken Chain
The chain of title is the unbroken sequence of recorded documents that moves ownership from one owner to the next.…
Read the guide